
Files in this item
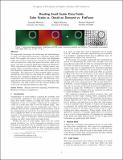
Reading small scalar data fields: color scales vs. Detail on Demand vs. FatFonts
Item metadata
| dc.contributor.author | Manteau, Constant | |
| dc.contributor.author | Nacenta, Miguel | |
| dc.contributor.author | Mauderer, Michael | |
| dc.date.accessioned | 2017-03-16T16:30:11Z | |
| dc.date.available | 2017-03-16T16:30:11Z | |
| dc.date.issued | 2017-05-16 | |
| dc.identifier | 249366016 | |
| dc.identifier | 5509399e-0dc3-48cc-a072-6db073556b2a | |
| dc.identifier | 85044825144 | |
| dc.identifier.citation | Manteau , C , Nacenta , M & Mauderer , M 2017 , Reading small scalar data fields: color scales vs. Detail on Demand vs. FatFonts . in Proceedings of the 43rd Graphics Interface Conference (GI '17) . Canadian Human-Computer Communications Society , pp. 50-56 , Graphics Interface 2017 , Edmonton, Alberta , Canada , 16/05/17 . https://doi.org/10.20380/GI2017.07 | en |
| dc.identifier.citation | conference | en |
| dc.identifier.isbn | 9780994786821 | |
| dc.identifier.other | ORCID: /0000-0002-9864-9654/work/34034526 | |
| dc.identifier.uri | https://hdl.handle.net/10023/10484 | |
| dc.description.abstract | We empirically investigate the advantages and disadvantages of color- and digit-based methods to represent small scalar fields. We compare two types of color scales (one brightness-based and one that varies in hue, saturation and brightness) with an interactive tooltip that shows the scalar value on demand, and with a symbolic glyph-based approach (FatFonts). Three experiments tested three tasks: reading values, comparing values, and finding extrema. The results provide the first empirical comparisons of color scales with symbol-based techniques. The interactive tooltip enabled higher accuracy and shorter times than the color scales for reading values but showed slow completion times and low accuracy for value comparison and extrema finding tasks. The FatFonts technique showed better speed and accuracy for reading and value comparison, and high accuracy for the extrema finding task at the cost of being the slowest for this task. | |
| dc.format.extent | 7847671 | |
| dc.language.iso | eng | |
| dc.publisher | Canadian Human-Computer Communications Society | |
| dc.relation.ispartof | Proceedings of the 43rd Graphics Interface Conference (GI '17) | en |
| dc.subject | Color scales | en |
| dc.subject | FatFonts | en |
| dc.subject | Infotypography | en |
| dc.subject | Scalar Data Fields | en |
| dc.subject | Detail on Demand | en |
| dc.subject | QA75 Electronic computers. Computer science | en |
| dc.subject | DAS | en |
| dc.subject.lcc | QA75 | en |
| dc.title | Reading small scalar data fields: color scales vs. Detail on Demand vs. FatFonts | en |
| dc.type | Conference item | en |
| dc.contributor.sponsor | EPSRC | en |
| dc.contributor.institution | University of St Andrews. School of Computer Science | en |
| dc.identifier.doi | 10.20380/GI2017.07 | |
| dc.identifier.url | https://risweb.st-andrews.ac.uk/portal/en/datasets/reading-small-scalar-data-fields-color-scales-vs-detail-on-demand-vs-fatfonts-dataset(a6e5a750-1182-4fe8-803e-aef6aaf9fe27).html | en |
| dc.identifier.grantnumber | EP/M008932/1 | en |
This item appears in the following Collection(s)
Items in the St Andrews Research Repository are protected by copyright, with all rights reserved, unless otherwise indicated.