
Files in this item
The effect of visual and interactive representations on human performance and preference with scalar data fields
Item metadata
| dc.contributor.author | Han, Han L. | |
| dc.contributor.author | Nacenta, Miguel A. | |
| dc.contributor.editor | Chevalier, Fanny | |
| dc.contributor.editor | Jacobson, Alec | |
| dc.date.accessioned | 2020-10-30T15:30:01Z | |
| dc.date.available | 2020-10-30T15:30:01Z | |
| dc.date.issued | 2020-05-28 | |
| dc.identifier | 270837356 | |
| dc.identifier | 91836810-5910-4e05-90cf-f182791a95a4 | |
| dc.identifier | 85090782044 | |
| dc.identifier.citation | Han , H L & Nacenta , M A 2020 , The effect of visual and interactive representations on human performance and preference with scalar data fields . in F Chevalier & A Jacobson (eds) , Proceedings of Graphics Interface 2020 . vol. 2020-May , Proceedings - Graphics Interface , Canadian Human-Computer Communications Society / Société canadienne du dialogue humain-machine , pp. 225 - 235 , Graphics Interface 2020, GI 2020 , Toronto, Virtual, Online , Canada , 28/05/20 . https://doi.org/10.20380/GI2020.23 | en |
| dc.identifier.citation | conference | en |
| dc.identifier.isbn | 9780994786852 | |
| dc.identifier.issn | 0713-5424 | |
| dc.identifier.other | ORCID: /0000-0002-9864-9654/work/82500967 | |
| dc.identifier.uri | https://hdl.handle.net/10023/20864 | |
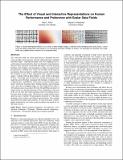
| dc.description.abstract | 2D scalar data fields are often represented as heatmaps because color can help viewers perceive structure without having to interpret individual digits. Although heatmaps and color mapping have received much research attention, there are alternative representations that have been generally overlooked and might overcome heatmap problems. For example, color perception is subject to context-based perceptual bias and high error, which can be addressed through representations that use digits to enable more accurate value reading. We designed a series of three experiments that compare five techniques: a regular table of digits (Digits), a state-of-the-art heatmap (Color), a heatmap with an interactive tooltip showing the value under the cursor (Tooltip), a heatmap with the digits overlapped over it (DigitsColor), and FatFonts. Data analysis from the three experiments, which test locating values, finding extrema, and clustering tasks, show that overlapping digits on color (DigitsColor) offers a substantial increase in accuracy (between 10 and 60 percent points of improvement over the plain heatmap (Color), depending on the task) at the cost of extra time when locating extrema or forming clusters, but none when locating values. The interactive tooltip offered a poor speed-accuracy tradeoff, but participants preferred it to the plain heatmap (color) or digits-only (Digits) representations. We conclude that hybrid color-digit representations of scalar data fields could be highly beneficial for uses where spatial resolution and speed are not the main concern. | |
| dc.format.extent | 11919822 | |
| dc.language.iso | eng | |
| dc.publisher | Canadian Human-Computer Communications Society / Société canadienne du dialogue humain-machine | |
| dc.relation.ispartof | Proceedings of Graphics Interface 2020 | en |
| dc.relation.ispartofseries | Proceedings - Graphics Interface | en |
| dc.rights | Copyright © 2020 the Author(s). This work has been made available online in accordance with publisher policies or with permission. Permission for further reuse of this content should be sought from the publisher or the rights holder. This is the author created accepted manuscript following peer review and may differ slightly from the final published version. The final published version of this work is available at https://doi.org/10.20380/GI2020.23. | en |
| dc.subject | Human-centered computing-Visualization-Visualization design and evaluation methods | en |
| dc.subject | Human-centered computing-Visualization-Visualization techniques-Treemaps | en |
| dc.subject | QA75 Electronic computers. Computer science | en |
| dc.subject | T Technology | en |
| dc.subject | Computer Graphics and Computer-Aided Design | en |
| dc.subject | NS | en |
| dc.subject.lcc | QA75 | en |
| dc.subject.lcc | T | en |
| dc.title | The effect of visual and interactive representations on human performance and preference with scalar data fields | en |
| dc.type | Conference item | en |
| dc.contributor.institution | University of St Andrews.School of Computer Science | en |
| dc.identifier.doi | 10.20380/GI2020.23 | |
| dc.identifier.url | https://openreview.net/forum?id=Jf2GPYsoEj | en |
This item appears in the following Collection(s)
Items in the St Andrews Research Repository are protected by copyright, with all rights reserved, unless otherwise indicated.